


Over the past 100 years, there have been four major pandemics that have collectively killed more than 60 million people. The most notorious of these pandemics is the 1918 Spanish flu, which infected 50 percent of the world's population and killed more than 50 million people.
Spanish Flu: Did Aspirin Make It More Deadly?
The Spanish flu first appeared in the United States in the spring of 1918, and initially was confined to army barracks of soldiers returning from World War I. At first, the death rate associated with this flu was relatively low, and many states practiced social distancing and mask wearing, which produced temporary reduction in outbreaks over the summer. Unfortunately, the following fall the Spanish flu returned with a vengeance, killing nearly four times as many people as the first wave.
 One of the most disturbing aspects of the Spanish flu was that it specifically targeted young adults. People between the ages of 25 and 29 had a particularly high morbidity/mortality rate, as nearly 30 percent of this population was infected and 1 percent died of pneumonia or influenza. The mechanism for the high death rate in such a healthy population had been a mystery until 2009, when Karen Starko published a paper in Clinical Infectious Diseases.1
Dr. Starko pointed out that because Bayer Pharmaceutical's patent on aspirin expired in 1917, this drug suddenly become available in large quantities for very low costs. As hundreds of thousands of infected people presented with high fevers, doctors began prescribing aspirin in doses three to 10 times greater than the current prescription levels. Official recommendations for the widespread use of aspirin were issued by the surgeon general in September 1918, and this order was almost immediately followed with a large spike in deaths, initially peaking in the Armed Forces and then rapidly spreading throughout the rest of the U.S. population. The highest death rate was in a U.S. Army camp, where army doctors ordered more than 100,000 aspirin tablets, which were prescribed at nearly toxic levels.
Although medical experts were unaware of it at the time, salicylates in high doses predispose to bacterial pneumonia by increasing lung fluid and impairing mucociliary clearance. Interestingly, homeopaths at the time noticed that influenza patients who avoided aspirin had lower mortality rates.2
Asian Flu and Vaccine Problems
Following the 1918 epidemic, influenza went back to typical patterns of regional epidemics from the 1930s through the mid-1950s that were relatively benign. That all changed in 1957 when the Asian flu arrived in the U.S. following initial outbreaks in Hong Kong. The antigenic sequence of the 1957 pandemic was a H2N2 influenza A. This new virus was the result of a re-assortment between the 1918 H1N1 and a less lethal circulating avian influenza strain.
Unlike the Spanish flu, the H2N2 influenza produced rapid death and lung consolidation without bacterial infection. Oddly, the H2N2 virus targeted women in their third trimester of pregnancy. Similar to the Spanish flu, the H2N2 influenza had early outbreaks in the spring that were followed by much more lethal outbreaks the following fall. By the time it was over, the 1957 pandemic killed 4 million people worldwide, 116,000 in the United States.3 (Keep in mind that the U.S. population at the time was 170 million, which would be the equivalent of 230,000 deaths given our current population.)
One of the most surprising aspects of the 1957 pandemic is that so few people were aware of it. There was no social distancing and businesses were not forced to shut down.4 The economic impact was insignificant and the GDP in the U.S. dropped only 1 percent.5 In contrast to today's COVID-19 crisis, hospitals were not overloaded, as there was a concerted effort to promote home care for uncomplicated cases.
After the initial H2N2 outbreak, scientists rapidly developed a vaccine that was available for mass distribution less than three months after the virus's arrival. Despite widespread distribution of the vaccine, deaths continued to mount and even today, it is difficult to find information on the efficacy of the 1957 vaccine. The CDC website has less than a paragraph on the 1957 H2N2 pandemic and no information at all on the vaccine.
After going through everything I could find on the '57 pandemic, I found a great paper published in 2006 by Edwin Kilbourne, a world-famous virologist who summarized vaccine research on pandemics and epidemics over the past 60 years.6 Dr. Kilbourne cites a research paper from 1961 in which experts from the time state the vaccination was initially ineffective as it was given in doses too low to initiate a primary antibody response.7
The authors state that as recurrent infections occurred in the population between 1958 and 1960, antibody levels increased and the vaccine eventually became effective. Apparently, the prior infections "primed" the infected individuals, allowing their immune system to respond to the virus. By the time the '57 flu had passed, nearly 40 percent of the American population had antibodies to H2N2.
Hong Kong Flu: More of the Same
The next major pandemic was the H3N2 Hong Kong influenza of 1968. This influenza had the same rate of infection as the Spanish flu: each infected person infected 1.8 others. (Individuals with typical seasonal flu infect 1.27 others.) Because the Hong Kong influenza had the same N2 antigen as the 1957 pandemic, the death rates were relatively low, as so many people had partial immunity following widespread exposure to H2N2 influenza in 1957. Dr. Kilburn states: "[T]he amelioration of the H3N2 virus by immunity to the N antigen alone is all the more remarkable because of the capacity of the virus to kill."7
The H3N2 pandemic followed a typical influenza-like seasonal pattern, as it began in the late fall of 1968, disappeared over the summer, and was followed by a second wave the next winter. Worldwide, the 1968 pandemic killed nearly 2 million people, with 100,000 deaths occurring in the U.S.
Another H1N1 Virus: Did the WHO Overstep Its Bounds?
The 1968 outbreak of the H3N2 flu was followed by a long quiet period in pandemics, until another H1N1 surfaced in 2009. Unlike its 1918 predecessor, this H1N1 influenza virus was far less virulent than the Spanish flu, resulting in only 3,400 deaths in the U.S., and somewhere between 150,000 and 570,000 deaths worldwide.4 (This mortality rate is not that different from the typical seasonal flu, which kills between 250,000 and 500,000 people annually.)
As with prior pandemics, the initial wave of deaths occurring in the spring of 2009 were followed by another wave in the fall. Despite a relatively low death rate, the 2009 H1N1 was frightening, as it targeted children, young adults and pregnant women. The average age of confirmed death in the U.S. was 37.8
The 2009 pandemic was also unusual in that it also targeted obese individuals. Following the pandemic, researchers from Germany showed that individuals with body mass indexes over 30 have suppressed activity of their T-lymphocytes, greatly increasing risk of viral infection.9
Owing to the virulence of the H1N1 virus, the World Health Organization pushed for the rapid development of a vaccine. Within six months after the onset of the pandemic, a vaccine had been developed, though widespread distribution did not occur until after the pandemic had peaked.10 The CDC states that the vaccination program for this H1N1 influenza saved roughly 350 lives in the U.S.11
Following the pandemic, the British Medical Journal published an editorial criticizing the World Health Organization for overstating the risks associated with the 2009 pandemic, and for failing to disclose financial ties between WHO members supporting the multimillion-dollar vaccination program and their ties to the manufacturers of the vaccine.12
Fast Forward to COVID-19
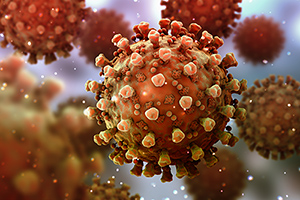
In December 2019, a novel coronavirus appeared in Hunan province of China that everyone now knows as COVID-19. Unlike influenza A, this coronavirus is comprised of long chains of RNA with S-spikes on the surface that bind to ACE receptors in the respiratory endothelium (Fig. 1). Following their attachment, this virus initiates a cytokine storm in which the body releases a wide range of pro-inflammatory mediators to combat the viral infection.
Despite the fact that 95 percent of infected people develop either no symptoms or mild symptoms only,10 this particular coronavirus spread rapidly throughout the world, because of its high rate of infection (each individual infected with COVID-19 will infect between 2.2 and 2.5 others), and the fact that it can be spread by asymptomatic individuals.
As of early May, the CDC is predicting approximately 147,000 deaths in the U.S. by August, and as with most pandemics, a recurrence is expected in the fall. The Center for Infectious Disease Research and Policy states that COVID-19 will most likely be with us for another 18 to 24 months, as it gradually synchronizes to a seasonal pattern with diminished severity over time.10
If there is one saving grace about the COVID-19 pandemic, it's that this coronavirus pandemic, unlike all prior influenza pandemics, has an extremely low mortality rate among young people. The average age of death from COVID-19 is between 80 and 82, and the probability of someone in their 20s or 30s dying from it is almost zero.13 This contrasts markedly with the 1918 and 2009 pandemics, in which the average age of death was 27 and 37, respectively.
Understanding the Risk Factors We Can Help Modify
In addition to targeting the elderly, COVID-19 is more likely to produce serious complications in individuals with hypertension, diabetes, obesity, cardiovascular disease, hyperlipidemia, and prior stroke. The common factor between all of these comorbidities is that people with the worst outcomes tend to have the highest levels of C-reactive protein upon initial presentation.
Originally discovered in the 1930s, C-reactive protein is a marker for inflammation and when levels are low, the risk of fatal infection is greatly reduced, regardless of the comorbidities. In my opinion, obesity should not necessarily be considered a comorbidity, as approximately 20 percent of individuals with high body mass indexes are metabolically healthy, and have stable lipid profiles and low C-reactive proteins.14
Diabetics are high risk for coronavirus infection for reasons independent of C-reactive protein. When diabetics fail to manage their blood sugar levels properly, the excess glucose is broken down into methylglyoxal and glyoxal, which suppress beta defensins, a series of peptides located in respiratory epithelium that are essential for regulating inflammation and controlling the immune system.15
A disturbing trend in the U.S. is that the number of people who are prediabetic is constantly increasing. Between 1994 and 2010, the prediabetic percentage of the population increased from 6 percent to 26 percent.16 Most of these people are unaware of their elevated glucose levels, which puts them at risk for respiratory tract infections due to suppressed beta defensins.
Home monitoring devices for measuring fasting blood glucose are available for less than $30 and given the connection between elevated glucose and impaired immune function, everyone should know their fasting blood glucose level.
Editor's Note: Part 2 of this article appears in the August digital issue and continues Dr. Michaud's discussion of how to protect those at risk for COVID-19 complications.
References
- Starko K. Salicylates and pandemic influenza mortality,1918–1919: pharmacology, pathology, and historic evidence. Clin Infect Dis, 2009;49:1405-10.
- Dewey WA. Homeopathy in influenza — a chorus of 50 in harmony. J Am Inst Homeop, 1921:1038-43.
- www.cdc.gov/flu/pandemic-resources/1957-1958-pandemic.html
- Saunders-Hastings P, Krewski D. Reviewing the history of pandemic influenza: understanding patterns of emergence and transmission. Pathogens,2016;5:66.
- Henderson D, Courtney B, Inglesby T, et al. J. Public health and medical responses to the 1957-58 influenza pandemic. Biosecur Bioterror, 2009; 7:265-273.
- Kilbourne, E. Influenza pandemics of the 20th century. Emerg Infect Dis, 2006;12:9.
- Meiklejohn G. International conference on Asian influenza. Am Rev Respir Dis, 1961;83:175-7.
- Viboud C, Miller M, Olson D, et al. Preliminary estimates of mortality and years of life lost associated with the 2009 a/H1N1 pandemic in the us and comparison with past influenza seasons. PLoS Curr Influenza, 2010;20:1153.
- Palch H, Sheridan P, Handy J, et al. Overweight and obese adult humans have a defective cellular immune response to pandemic H1N1 influenza A virus. Obesity, 2013 Nov;21:2377-2386.
- Moore K, Lipsitch M, Barry J, et al. "COVID-19: The CIDRAP Viewpoint." University of Minnesota. April 30, 2020.
- Borse R, Shrestha S, Fiore A, et al. Effects of vaccine program against pandemic influenza A(H1N1) virus, United States, 2009-2010. Emerg Infect Dis, 2013 Mar;19:439-48.
- Cohen D, Carter P. "WHO and the Pandemic Flu 'Conspiracies.'" BMJ, 2010;340:2912.
- www.mass.gov/doc/COVID-19-dashboard-may-19-2020/download
- Karelis A, Faraj M, Bastard J, et al. The metabolically healthy but obese individual presents a favorable inflammation profile. J Clin Endocrin Met, 2005;90:4145-4150.
- Kiselar J, Wang X, Dubyak G, et al. Modification of β-defensin-2 by dicarbonyls methylglyoxal and glyoxal inhibits antibacterial and chemotactic function in vitro. PLoS One, 2015;10:e0130533.
- Ramjee V, Sperling L, Jacobson T. Non-high-density lipoprotein cholesterol versus apolipoprotein B in cardiovascular risk stratification: do the math. J Am Cardiol, 2011;58:457-463.
Click here for more information about Thomas Michaud, DC.