


In part one of this article, we looked at some simple mathematical methods of estimating uncertainty in forensic practice, which can be used when it is necessary to make calculations based on best-guess assumptions and estimations.
In part one, we looked at some simple mathematical ways of estimating uncertainty; in part two, let's look at somewhat more sophisticated ways of estimating the effects of uncertainty, such as Bayes' theorem and the Monte Carlo statistic, one of the most powerful methods of uncertainty estimation.
Bayes' Theorem
Bayes' theorem is a method of calculating the probabilities of a "before" event conditional on an "after" event; conditional probability. It was named in honor of its discoverer, the Reverend Thomas Bayes. A good analogy (and, in fact, a real application) would be the physician who examines the patient on a number of occasions and, as a result, becomes progressively more certain of his or her diagnosis based on the changing a priori knowledge of the patient. The probability of making a correct diagnosis is increased by the physician's increasing experience with the patient. But suppose we were interested in estimating the probability that a non-physician, such as an ACR, a biomechanist, or insurance claims adjuster, could correctly determine whether a person would be injured in a low-velocity crash based only on the amount (or lack) of property damage present in his or her car after the collision. In this exercise, we will attempt to determine the outcome's probability based on the occurrence in the general population and the accuracy of the test applied.
To begin with, there are a few presumptions underlying this assumed correlation between property damage and occupant risk that I will conveniently avoid in the interest of simplicity. For example, we will assume, as ACRs, biomechanists, or insurance claims adjusters frequently do, that one can ignore the relative risk introduced by various occupant features such as age, position in the vehicle, prior physical health, etc. In truth, these variables generally are more important than crash metrics. Secondly, we'll assume that crash damage is linearly correlated with velocity. This is at the least a claimed belief of most ACRs, biomechanists, and insurance claims adjusters, but, in truth, is not true across the low-velocity spectrum. Having said that, let's get on with the conditional probability.
To determine the probability of an injury in a low-velocity, rear-impact collision at, say, a closing velocity of less than 10 mph, we can turn to the epidemiological literature. It shows that the risk is approximately 33 percent. To determine the accuracy of the test involved - in this case, the ability of ACRs to accurately estimate crash velocity based on a photograph of the crashed vehicle - we can turn to studies measuring this quantity. As Bartlett, et al., demonstrated, with a given crash photo demonstrating property damage, trained ACRs will estimate collision velocities across a very broad range.4 But this study measured only the ability to estimate collision velocity in a single crash in which there was substantial resulting property damage. No studies exist in which ACRs estimated crash velocities across a broad range of crashes and levels of property damage. It is likely that the ability of ACRs to correctly estimate crash velocity in crashes below the threshold of property damage (i.e., from below 12 mph) will be even lower, since there would be no physical evidence from which to base an estimate. Still, based on the Bartlett, et al., results, we'll assume the method is 90 percent accurate in about 50 percent of cases.
Thus, the conditional probability we will look at will be this: In a given low-velocity crash, what is the probability that an injury to one of the vehicle's occupants actually occurred? We might also ask:
What is the probability that an injury occurred if the accuracy of the ACR photo assessment of property damage method was 65 percent?
For this, we can use the following equation, which is a slight modification of Bayes' theorem:
![]()
where IA denotes the event of an indicated occurrence and A the event of an actual occurrence. The overall probability, p, is a ratio of the true positive injury assessments to the true positive injury assessments plus the false positive assessments. For the first part of this problem, then, we'll have p1=0.33 and p2=0.50. For the second part, we'll let p1=0.33 and p2=0.65. For the first part of the question, the probability of correctly characterizing a person as injured in a low-velocity collision based on damage assessment is 33 percent. In the second case, with 15 percent greater precision in the estimation method (i.e., 65 percent vs. only 50 percent), the probability of correctly characterizing a person as being injured increases to 48 percent; an increase of reliability of 46 percent. So, a slight change in method reliability makes a big difference in the ability to correctly characterize a crash victim.
Apart from this question of conditional probability using Bayesian techniques, which, by the way, can be extended to deal with additional components or events (using complex equations with difficult-to-solve integrals), our recent meta-analysis of the literature should relegate the property-damage-correlation-as-sole-indicator method of risk assessment to that ignominious museum of disproved scientific theories, if it even had a veneer of science.5 However, the utility of the presumed correlation (wrong as it may be) is so valuable to insurers as a device to appeal to jurors' intuition, that we should not expect its imminent demise at the hands of science. Meanwhile, it would be interesting to run the same conditional probability assessment based on a physician's examination and interview of individuals claiming to be injured. Would the value for p2 be greater than 65 percent in that case?
Monte Carlo Method
Monte Carlo statistics were first proposed by John von Neumann (one of the pioneers in computer science) and S.M. Ulam in the 1940s. Named after the gambling mecca of Monte Carlo, they were a way of simulating a large number of approximations and of making estimations about the probable distribution and range of a set of values. The computations were too intensive at the time the method was first proposed to be practical, but with the advent of the supercomputer, Monte Carlo statistical analysis became a reality. Today, most desktop computers have enough power to run them. Sometimes known as the Markov chain Monte Carlo method, Monte Carlo statistics are a method of generating bivariate normal random variables (which is a fairly good trick, since computer code is deterministic). Randomized quasi-Monte Carlo methods provide the ability to estimate error, and, using Latin supercube (aka, hypercube) sampling, it is possible to extend the method to higher dimensional problems.6-7 There are several statistical programs commercially available that can run Monte Carlo simulations.
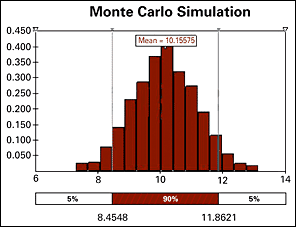
Here is an example of the Monte Carlo statistic applied practically. For a recent case in which I served as an expert, I first wanted to have some understanding of the forces the occupant would have been subjected to. Her car had been totaled and I had only two photos of it. Using the National Automotive Sampling System (NASS) database, I was able to locate a similar collision producing very similar damage, involving the same vehicle makes and models. The National Highway Traffic Safety Administration (NHTSA) field investigators had estimated the delta V of that crash to be 10 mph. Because the software used by NASS recently has been shown to underestimate delta V by approximately 20 percent in the majority (77 percent) of cases,8 it is likely the subject crash delta V was approximately 10-12 mph. I ran a Monte Carlo simulation, producing the graph below, indicating a mean delta V of 10.2 mph with a 90 percent probability that the true value lies between 8.5 mph and 11.9 mph. This crash velocity is well in excess of reported ranges in which injuries occur. To this, of course, one would add one's risk analysis based on other known risk factors, particularly those concerning the patient herself.
 I also pointed out that we have conducted full-scale crash tests in this range of collision speeds at the Spine Research Institute of San Diego. The target vehicle in this case was a stationary 1987 Chrysler Le Baron, which has head restraints of similar design and geometry to those of the 1994 Volvo 850, and the bullet vehicle was a 1994 Ford Crown Victoria traveling at 14.4 mph. The Le Baron's delta V was 10.1 mph. Using the highly biofidelic BioRID IIe anthropometric test dummy, we recorded head linear (x) acceleration peaks of 24.9 g in that crash test. The recorded vertical (z) acceleration was 15.8 g, with pelvic linear (x) acceleration of 15.7 g and pelvic vertical (z) acceleration of 28.0 g. The calculated Neck Injury Criterion (NIC) was 40 m2/s2, which is well in excess of the published threshold for serious neck injury of 15 m2/s2.9 It is noteworthy that the BioRID IIe is a 50th percentile male dummy weighing 175 lbs, whereas the patient is a 79th percentile female; females generally experience much larger head acceleration than males based on our tests and those of others.10-12 The forces and loads experienced by the patient would have exceeded SAE J885 standards and would have subjected her discs, ligaments and joints capsules to very high shear strains and compressive and tensile loading. (Note that we have recently published other dummy findings which may be useful in a similar way.13) We can then discuss clinical findings and correlate them to these forces.
Conclusion
In part one of this article, we looked at some simple mathematical methods for gauging uncertainty in the forensic practice. These can be done by anyone with a pocket calculator. A more complicated method employing differential calculus (Taylor series) also was mentioned, but the simpler method is preferable because it provides broader (and more conservative) estimates of uncertainty. In part two, we looked at a simple example of Bayesian methods of conditional probability. The Monte Carlo error estimation provides a more realistic and reliable estimation of the range of uncertainty in this kind of project and, as a result, will carry significantly greater weight in a for-ensic setting. It is one of the most powerful methods of increasing the confidence in the true range of uncertainty available today.
References
- Guide to the Expression of Uncertainty in Measurement. 1993, Geneva: International Organization for Standards (ISO).
- American National Standard for Expressing Uncertainty; U.S. Guide to the Expression of Uncertainty in Measurement. ANSI/NCSL Z540-2-1997; NCSL International, 2000, Boulder: American National Standards Institute (ANSI) and National Conference of Standards Laboratories (NCSL).
- Brach, RM, and P.F. Dunn. Uncertainty Analysis For Forensic Science. 2004, Tuscon: Lawyers & Judges Publishing Company, Inc.
- Bartlett, W, et al. Evaluating the uncertainty in various measurement tasks common to accident reconstruction. Accident Reconstruction 2002; (SAE 2002-01-0546): p. 57-68.
- Croft, AC, and M.D. Freeman. Correlating crash severity with injury risk, injury severity, and long-term symptoms in low velocity motor vehicle collisions. Medical Science Monitor 2005;11(10):RA316-321.
- Owen, AB. "Monte Carlo Extension of Quasi-Monte Carlo." 1998 Winter Simulation Conference.
- Robert, CP, and G. Casella. Monte Carlo Statistical Methods, 2nd ed. 2004, New York: Springer.
- Gabler, HC, C.E. Hampton and J. Hinch. "Crash Severity: A Comparison of Event Data Recorder Measurements With Accident Reconstruction Estimates." SAE Technical Paper Series 2004 (2004-01-1194).
- Croft, AC, et al. The neck injury criterion: future considerations."Accid Analy Prev 2002;34(2): 247-55.
- Siegmund, G, et al. "Head/Neck Kinematic Responses of Human Subjects in Low-Speed Rear-End Collisions." SAE Technical Paper 973341, 1997: p. 357-385.
- Brault, JR, et al. Clinical response of human subjects to rear-end automobile collisions."Arch Phys Med Rehabil 1998;79(1):72-80.
- Croft, AC, M. Haneline, and M. Freeman. "Differential Occupant Kinematics and Forces Between Frontal and Rear Automobile Impacts at Low Speed: Evidence for a Differential Injury Risk." International Research Council on the Biomechanics of Impact (IRCOBI), International Conference, Munich, Germany, Sept. 18-20, 2002: p. 365-366.
- Croft, AC, and M.M.G.M. Philippens. "The RID2 Biofidelic Rear Impact Dummy: A Validation Study Using Human Subject in Low Speed Rear Impact Full Scale Crash Tests. Neck Injury Criteria (NIC)." 2006 SAE World Congress. Detroit, MI: SAE.
Click here for previous articles by Arthur Croft, DC, MS, MPH, FACO.