Equivalent Barrier Speed
Equivalent Barrier Speed (EBS) is sometimes referred to as equivalent energy speed (EES), barrier equivalent velocity (BEV) and a confusing array of other similar acronyms, proving that engineers are basically as disorganized as those of us in health care, where redundant acronyms and eponyms are also common. However, these barrier terms all have the same meaning and were derived empirically from observing the results of many staged crashes into fixed barriers, most of which have been conducted in the 30 mph range in order to satisfy Federal Motor Vehicle Safety Standard requirements.
The analysis method requires the placement of a grid over the damaged vehicle. A series of six measurements of crush are taken along the crush zone. These figures are put into a rather tedious equation into which one also supplies constants and other variables related to the particular vehicle's characteristics, such as mass, wheel base, etc. These values can be obtained from published tables.
Unfortunately, these equations become unreliable at low speeds and have no practical use in LOSRIC. Moreover, delta V and EBS are not equal except in specific circumstances, such as when the masses and stiffnesses of the two colliding cars are similar.3 After all, crashing a vehicle into a rigid barrier is roughly the same as crashing it into itself. Having said that, you can be sure that I include this information for a purpose: some ACRs do apply EBS to LOSRIC. In fact, I'm working on a case right now where the ACR used ABS in a nearly no-damage crash.
Physical Evidence of Forces
In addition to the obvious signs of a crash (crushed sheet metal, bent or damaged bumper components, etc.), other subtle but telling signs can become important clues as to the forces experienced by a car's occupants in a crash. When the occupant loads the seat belt/shoulder harness webbing violently in a crash, lasting evidence may become visible in several forms: 1) "Brinelling" (the wearing down of sharp surfaces) of the locking pawl and/or spool socket of the retractor mechanism results from the forced stripping out of webbing which is resisted by the ratcheting of these gears; 2) The anchorages of the seat belt and shoulder harness at the floorboard (most commonly) and B pillar, respectively, may be deformed; 3) "Witness marks" (visible or palpable irregularities) may be visible on the webbing material as it was drawn under high pressure through the D ring assembly; 4) The plastic D ring assembly may also show witness marks from the webbing spooling under pressure; 5) The guide rails and/or seat back frame may be bent or deformed; and 6) The head restraint supports may be deformed. Such witness marks are also useful in determining whether the restraint belts were actually worn, although marks are not always visible.
Bumper Isolator Systems
Not an Occupant Safety DeviceBumper isolators are specially designed shock absorbers that mount between the frame and bumper and are designed to reduce that amount of property damage to vehicles. The original Federal Motor Vehicle Safety Standard (FMVSS 215) which applied to these systems was later changed to a federal regulation because it was not a safety standard per se. I mention this because defense lawyers often incorrectly suggest that the intent was to diminish occupant injuries by absorbing energy.
This is a fallacy. The original regulation has been through several modifications since its introduction as regards pendulum and barrier impact regulations (e.g., 2.5 mph vs. 5 mph ratings).4, p. 41-42 However, improved human tolerance to rear (or frontal) impacts was not contemplated, tested or validated through this rule change, despite this common misconception that the chief purpose was to minimize occupant loading. In fact, the official stated purpose of the new bumper standard concerned only the maintenance of the integrity of exhaust, fuel, cooling and lighting systems, and the ability to open the trunk, hood and doors following a crash. And while there is no isolators reduce the loads to occupants in any significant way in LOSRIC (i.e., they don't appreciably reduce the incidence of injuries as far as we can tell), they do prove to be helpful in the analysis of these very crashes, as we'll see in Part IV.
Usefulness in ACR
The isolator is an air- and gas-filled system which works in the following way. Upon initial compression, gas is compressed, acting primarily as a spring. With increasing compression, a metering pin allows movement of oil through a metering hole. Since the movement of oil will be in both directions, it provides a viscous fluid damping and allows the bumper to rebound less violently than a simple spring. As the piston moves within the cylinder during this compression, characteristic score marks are left on the piston.
Researchers have tested these devices and have quantified the forces (in delta V) necessary to compress these pistons on a number of different vehicles. This data is readily available and allows us to estimate the target (i.e., struck) vehicle's delta V in LOSRIC in many cases with reasonable (ok sign) accuracy. There are, however, several limitations to this method:
- Particularly on older cars, the isolators may have become frozen. In such cases, they will not compress and the analysis will be inaccurate.
- Some isolators have tapered pistons which do not leave score marks behind when compressed.
- In oblique impacts, the direction of impact is not in perfect alignment with the isolator travel and more energy may be required to compress them.
- At higher speeds, the isolators will collapse completely, resulting sometimes in a discharge of oil. Measuring stroke marks will usually underestimate the forces if full compression has occurred.
- Many newer cars do not have isolators but are equipped with corrugated "one-shot" struts which deform in a controlled fashion; other, more common systems consist of polyurethane or polystyrene viscoelastic systems which unfortunately leave virtually no telltale signs of compression.
Gunter Siegmund and his colleagues3 have compiled a rather extensive set of data from 938 vehicle-to-barrier and vehicle-to-vehicle tests of bumpers in low-speed crashes. And while only five different vehicles were used in these tests, they can be shown to be reasonably representative of such crashes with similar sized cars. The authors noted that no relationship was found between bumper ratings (2.5 mph or 5 mph) and the threshold for bumper damage, obliquely addressing another commonly held misconception of some ACRs that absence of bumper damage to a 5 mph-rated bumper implies that the collision speed would necessarily have been something less than 5 mph. (In some cases this is not misconception; it's pure deception.) They also found that comparison of the vehicle-to-vehicle tests and vehicle-to-barrier tests indicated that barrier data would not provide an accurate estimate of a vehicle's speed change in all cases. Barrier data gave a sometimes higher speed change, and I suspect this may reveal the difference between one set of isolators vs. two sets in vehicle-to-vehicle crashes.
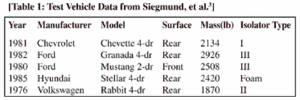
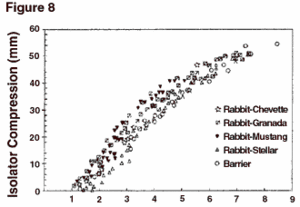
In Figure 8, we see a summary plot of the correlation of isolator compression and speed change for 833 tests within the vehicle-to-vehicle data set. Keep in mind the limitation that these tests represent not 833 random and individual vehicle-to-vehicle crash scenarios, but rather multiple data points obtained with a small number of different cars. Relevant test vehicle information is provided in Table 1.
Figure 8: A summary plot of 833 vehicle crashes between Rabbit and Chevette, Rabbit and Grenada, Rabbit and Mustang, Rabbit and Stellar, and Rabbit and a fixed barrier. Compression of isolators is compared to speed change. Some points are deliberately omitted for clarity. Adapted from Siegmund et al.{With permission from Whiplash: the Masters Certification Program, Module 2.]
The reader must be cautious when applying the isolator travel/speed change data from Figure 8. When permanent vehicle crush has occurred, one can usually assume that the isolators have bottomed out and the crash behavior and severity are most likely beyond the range illustrated in the graph; extrapolations are not permissible beyond the data set. However, Siegmund et al.5 have tested a large number of different vehicle bumper systems and specific crash data may be available from them. In addition, MacInnis Engineering Associates, Ltd. (www.maceng.com ) - where these tests were conducted - does have a large library of data which are made available on a case-by-case basis for a nominal fee.
A few of the findings in this paper5 are noteworthy. The authors found that the durations of the crash - an important factor in our reconstruction of LOSRIC - vary as a function of velocity change, being short for very low velocity changes, increasing for moderate velocity changes, and then decreasing for higher velocity changes. However, in the 2.5-5.0 mph range, the impact duration decreases almost linearly as velocity change increases so that, as the velocity change doubles from 2.5 mph to 5 mph, the duration decreases by a minimum of one third such that the average vehicle acceleration may be at least tripled. However, these same authors6,7 subsequently found in the crash tests of human volunteers in this same range that 29% and 38% complained of injury symptoms following exposures to 2.5 mph and 5 mph crash sequences respectively, and that the vehicle's crash duration and the occupant's kinematic response durations did not coincide completely.
Another important paper, as concerns the bumper isolator issue in occupant injury potential discussions, is that of Murray Kornhauser.8 He called attention to the fact that collisions between vehicles equipped with bumper isolators could often exceed the published cervical spine injury thresholds by a wide margin without resulting in permanent crush of either vehicle.
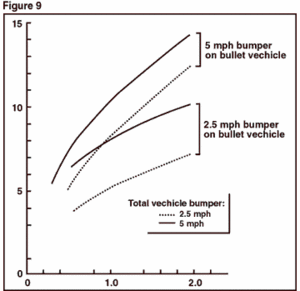
Figure 9 is an adaptation from this paper. It displays a theoretical comparison of four rear-impact crash scenarios based on two vehicles colliding with different variations of bumper ratings along a range of relative weight ratios. From this, we can take an example of a larger vehicle (4,200 lbs.) striking a smaller vehicle (2,100 lbs.), each of them equipped with 5 mph-rated bumpers. The graph suggests that a 14 mph velocity change could theoretically occur with little or no structural damage to the cars. It is notable that severe spinal cord injuries have been reported in this range.9 Clearly, the potential for less severe cervical acceleration/deceleration (CAD) injury also exists within the range of crashes in which structural damage does not exist. Further, if no damage to the vehicles occurred in such a crash, it would still have relatively elastic behavior. Thus, we could crudely use the ratios obtained by other researchers to estimate that the closing velocity required to cause a 14 mph delta V would be in the neighborhood of 20 mph or more. By definition, it would be more appropriately classified as a high speed rear impact collision (HISRIC). Bear in mind, however, that although this model is consistent with experimental data in the lower speed ranges, it has not been tested at higher speeds.
[Figure 9: Velocity change of target vehicle resulting from collisions between vehicles with either 2.5 mph or 5 mph-rated bumpers, as a function of their relative mass. These are zero-damage collisions (excluding, of course, cosmetic damage in the form of scrapes, scratches and scuffs). Adapted from Kornhauser. [With permission from Whiplash: the Masters Certification Program, Module 2.]
Computer-Based Solutions to LOSRIC
Currently, over a dozen computer programs are available to aid the ACR in reconstructing crashes. Some are extremely robust - and carry a price tag attesting to that fact - while others are less sophisticated. Programs which attempt to answer the question, "What happened?" should be distinguished from those which attempt to answer the question, "What would happen if ... ?" The latter are crash simulation programs and, for medicolegal purposes, have limited application. The former type merely analyze the crash based upon the user's input of (hopefully accurate) data. As always, the axiom garbage in, garbage out applies here.
In the early 1970s,10 a paper was published which developed the notion that there existed a linear relationship between crush depth and impact force. Dissipated energy, expressed as delta V, could be estimated by examining the appearance of residual crush (Note: residual crush is always less than dynamic crush because the bending metal always rebounds to some degree.) The author developed coefficients of force offset and force stiffness per unit width of the front of a car by dividing the force characteristic by the width of the car.
This original work, which was derived through empirical means, became the basis for the development of the CRASH computer program for Calspan.11 The program has a component for analyzing damage and another for dealing with vehicle spinout, which I won't discuss here. The CRASH program has been improved and is now in the CRASH3 iteration; other programs have been subsequently derived from it, including CRASHEX and EDCRASH. CRASH has become one of the most widely used - and most widely criticized - computer programs in ACR.
Unquestionably, the granddaddy of PC platform programs is Herman Stefan's PC Crash, which is marketed by Macinnis Engineering. You can download trial versions from their web site. The day after Princess Di's tragic death, Herman, using the copious photos supplied by the local papers (we were in England then) and PC Crash, reconstructed the crash. I've not heard the results of a single other reconstruction, but I'll be interested to see how close Herman came.
The chief limitation to relying on empirical data collected, as it is, over a very narrow crash velocity range, is that one must assume that extrapolation beyond the range of data is a reasonable adventure. As it turns out, it is not. The relative stiffness of a crushing car varies over a broad range and is therefore not a strictly linear relationship as most programs assume. At low speeds at which there is no crush, these computer models usually overestimate velocity. A true plot of delta V vs. crush (i.e., force deflection curve) is nonlinear, with the front of the car initially stiff. As more force is applied, this part gives in quickly and crushes up to two feet rapidly. When the engine compartment begins to crush, the relative stiffness increases so that a unit increase in force results in less increase in deflection. Once the occupant compartment (safety cage) is breached, the car again becomes relatively soft. To my knowledge, none of the currently available computer programs are particularly useful in the reconstruction of LOSRIC. Also, one must still understand the science of reconstruction to use them.
In the next (and final) part of this series, I'll outline the current best method of LOSRIC ACR.
References
- Fricke LB. Traffic Accident Reconstruction. Volume 2 of the Traffic Accident Investigation Manual. Evanston, IL: Northwestern University Traffic Institute, 1990, pp. 68-127.
- Szabo TJ, Welcher JB, Anderson RD, et al. Human occupant kinematic response to low speed rear-end impacts. SAE Tech Paper Series 940532; 1994, pp. 23-35.
- Siegmund GP, King DJ, Montgomery DT. Using barrier impact data to determine speed change in aligned, low speed vehicle-to-vehicle collisions. SAE Technical Paper Series 960887; 1996, SAE, pp. 147-167.
- Croft AC. Whiplash: The Masters' Certification Program, Module 1. Whiplash: Advanced Topics. San Diego; Spine Research Institute of San Diego, 1999.
- Siegmund GP, Bailey MN, King DJ. Characteristics of specific automobile bumpers in low velocity impacts. SAE Technical Paper Series 940916; 1994, SAE, pp. 333-371.
- Brault JR, Wheeler JB, Siegmund GP, Brault EJ. Clinical response of human subjects to rear-end automobile collisions. Archives of Physical Medicine & Rehabilitation 1998;79:72-80.
- Siegmund GP, King DJ, Lawrence JM, Wheeler JB, Brault JR, Smith TA. Head/neck kinematic response of human subjects in low-speed rear-end collisions. SAE Technical Paper 973341; 1997, pp. 357-385.
- Kornhauser M. Delta-V thresholds for cervical spine injury. SAE Technical Paper Series 960093; 1996, pp. 1-13.
- Ward C, Hoffman M. Mechanisms of injury and associated forces in high speed rear-end impacts. High Speed Rear Impact TOPTEC, Tempe, AZ, Oct. 27-28, 1997.
- Campbell KL. Energy basis for collision severity. SAE Technical Paper 740565; SAE, 1974.
- McHenry RR. A comparison of results obtained with different analytical techniques for reconstruction of highway accidents. SAE Technical Paper 750893; SAE, 1975.
Click here for previous articles by Arthur Croft, DC, MS, MPH, FACO.


